Movies Project
The project includes all stages of working with data in Tableau: importing data,
transforming data, building a data model, adding calculations using a calculated field,
implementing high-quality and interactive visualization with filters.
In this project, the data of the Movie_data_set, which consists of 4 data sets in the
format of Excel tables, was used.
The data was transformed (the data types were changed to the appropriate ones) in the
Data Source and a hierarchical data model was created by keys with a node - movie
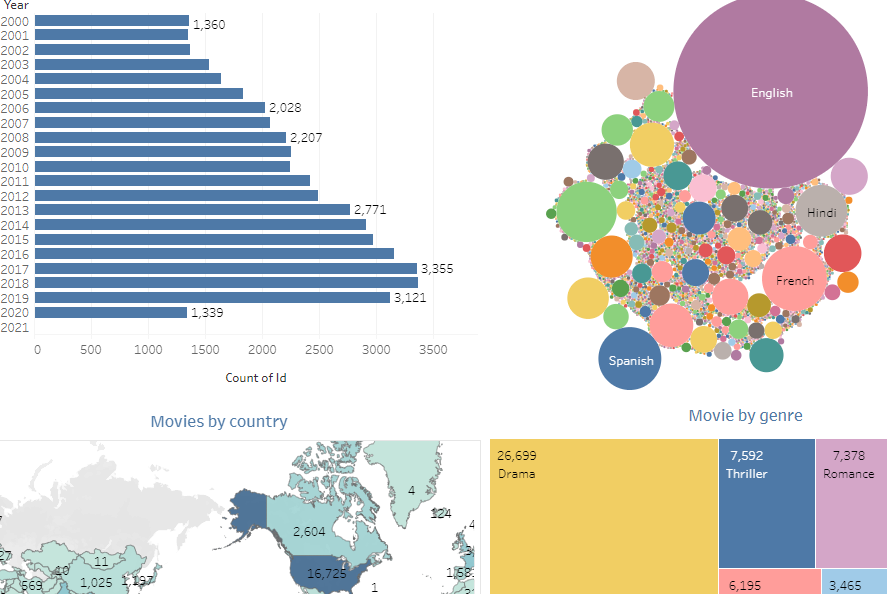
The dashboard consists of 4 visualizations and 2 tables:
bar chart of movie totals by year,
bubble chart of the number of films by language,
map of the number of films by producing countries,
treemap to show the number of movies by genre,
tables of the number of films by year, the change in the number in relation to the
previous year as a percentage and the average length of films in a year
(for the average duration of films, the calculation field Avg Duration - AVG([Duration]))
was created,
tables of awards by category and percentage in the total number of awards.
The data in the dashboard is filtered by years, countries and genres. Also,
all visualizations act as filters.
