Minnesota Traffic Project
View the Minnesota Traffic Project
The Minesote Traffic Project includes working with the Customer provided by the Metro
Interstate Traffic Volume Data.Csv file. A layout of visualization was created.
Data is downloaded to Tableau, a new IS_HOLIDAY column was created in the data viewing
tool using a Calculated Field to determine whether the day is festive
(if [Holiday] = "None" then null else "X" end)
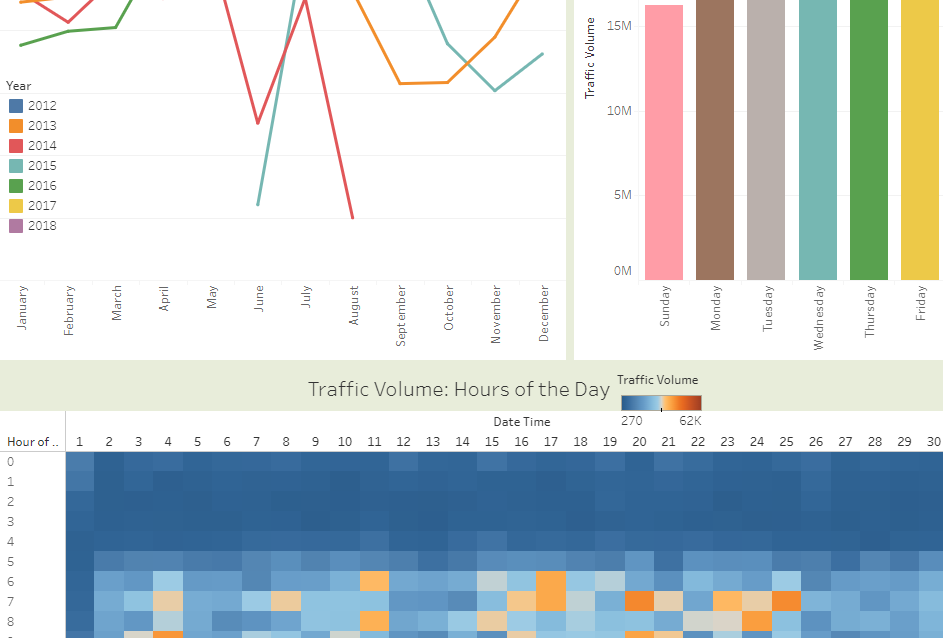
5 diagrams were created:
linear chart of traffic by years and places,
bar chart of traffic by day of the week,
thermal card for detailed demonstration of traffic by months, days, hours
(columns on this heat map represent the day of the month and rows - hours of the day),
bar chart of traffic dependence on weather conditions,
bubble diagram of the number of traffic on holidays.
All charts are combined into Dashboard with filters by years and months.
Business task:
Create business analytics visualization to help Minnesota's transportation Department
to improve the infrastructure of highways.
-The most important charts should reflect the following needs:
Intensity of transportation during the year; ideally organized by years, months, weeks,
days and hours
-The intensity of movement in different weather conditions
-The intensity of traffic on different holidays
